Strategic Profit Model 4h4219
This document was ed by and they confirmed that they have the permission to share it. If you are author or own the copyright of this book, please report to us by using this report form. Report 3l3c15
Overview 3z723u
& View Strategic Profit Model as PDF for free.
More details 2i4a6q
- Words: 1,014
- Pages: 4
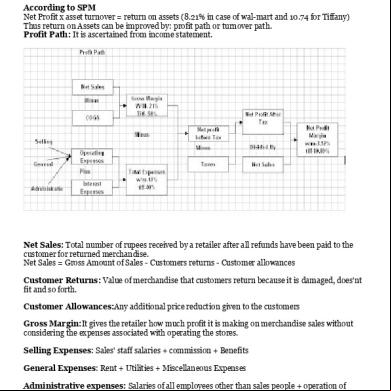
Strategic Profit Model Strategic profit model combines the two decision making areas: Margin management and asset management. The SPM uses return on assets as the primary criterion for planning and evaluating a firm's financial performance According to SPM Net Profit x asset turnover = return on assets (8.21% in case of wal-mart and 10.74 for Tiffany) Thus return on Assets can be improved by: profit path or turnover path. Profit Path: It is ascertained from income statement.
Net Sales: Total number of rupees received by a retailer after all refunds have been paid to the customer for returned merchandise. Net Sales = Gross Amount of Sales - Customers returns - Customer allowances Customer Returns: Value of merchandise that customers return because it is damaged, does'nt fit and so forth. Customer Allowances:Any additional price reduction given to the customers Gross Margin:It gives the retailer how much profit it is making on merchandise sales without considering the expenses associated with operating the stores. Selling Expenses: Sales' staff salaries + commission + Benefits General Expenses: Rent + Utilities + Miscellaneous Expenses istrative expenses: Salaries of all employees other than sales people + operation of buying offices + other istrative expenses
1
Receivables are monies due to retailer from selling merchandise on credit Cash Monies on hand + demand and savings s in banks to which a retailer has immediate access+ marketable securities such as Treasury Bill Other Current Assets Prepaid Expenses + Supplies Fixed Assets:Assets that require more than a year to convert to cash Fixed Assets = Buildings( if owned) + Fixtures(display racks) + equipment ( such as computer and delivery trucks) + long term investment such as real estate or stock in other firms Measure of a Merchandise Manager's Performance GMROI: Gross Margin Return on Inventory Investment It measures how many gross margins rupees are earned at every rupee of inventory investment GMROI= Gross margin % x sales to stock ratio GMROI= (gross margin/ net sales) x (net sales/ average inventory at cost) : Average inventory in GMROI is measured at cost. Range of GMROI for apparels is 235% and for furniture is about 90% it is no wonder that many stores are placing so much emphasis on apparels and some have even discontinued furniture. However some stores continue to carry low GMROI products, because traditioanlly consumer is attracted to the store becasue of it. The retailer hopes that these consumers will purchase high GMROI items. The strategic profit model, another name for the DuPont Equation, provides one method for calculating the return on equity. Return on equity refers to a business’s profit relative to shareholder equity or, put another way -- the effectiveness of the business at turning assets and investments into profit. The strategic profit model employs three key components: profit margin, asset turnover and leverage. 2
What Are the Key Components of the Strategic Profit Model? The strategic profit model calculates return on equity.
Tips on Starting an HVAC Business How to Restore an iPhone That Hangs on the Apple Screen How to Make Money With Straight Truck & Cargo Van Shipments Why Is the Internal Rate of Return Important to an Organization? If an Employee Files for Unemployment Benefits, Does the Company Pay? How to Turn Scanned Hand Drawings Into AutoCAD Drawings The strategic profit model, another name for the DuPont Equation, provides one method for calculating the return on equity. Return on equity refers to a business’s profit relative to shareholder equity or, put another way -- the effectiveness of the business at turning assets and investments into profit. The strategic profit model employs three key components: profit margin, asset turnover and leverage. Profit Margin The first key component of the strategic profit model is profit margin. Determine profit margin by subtracting total costs, such as materials, from the total sales to arrive at net income. Then divide your net income by your sales revenue to arrive at a percentage. That percentage represents your net profit margin. For example, say your company achieved $1.5 million in sales last year with total costs of $1 million. Your net income equals $1.5 million minus $1 million, or $500,000. Dividing that figure by $1.5 million leaves you with a profit margin of approximately 33 percent. Higher profit margins result in higher return on equity. Asset Turnover The second key component, asset turnover, measures a business’s efficiency at creating revenue from its assets. Calculate asset turnover by taking your sales revenue and dividing it by your total assets. Say your company generates $1.2 million in sales with $4.6 million in assets. You divide $1.2 million by $4.6 million to determine your asset turnover hovers around 26 percent. If asset turnover decreases, the return on equity decreases. Leverage Leverage represents the final component of the strategic profit model. In essence, leverage refers to the debt-to-equity ratio, or how much debt you take on relative to your business’s equity. Calculate leverage by taking your total liabilities, such as mortgages and revolving lines of credit, and dividing them by your total equity. If your business’s total liabilities equal $2.2 million and your business’s total equity is $5.9 million, you wind up with leverage around 37 percent. Return on Equity Determine return on equity by multiplying your net profit margin, asset turnover and leverage. If your company holds a 36 percent profit margin, a 40 percent asset turnover and 37 percent leverage, you end up with a return on equity of approximately 5 percent. A return on equity of approximately 10 percent to 12 percent represents the norm. 3
Other Considerations The strategic profit model lends itself to a visual format, making it an excellent tool for demonstrating how changes in profit margins, leverage or asset turnover impact the business. It also provides a simple way to see and evaluate changes over time. The strategic business model suffers from the problem that the results only prove as reliable as the original data. If your business does not maintain accurate records, the numbers you get from the calculations provide little value.
4
Related Documents g842
Strategic Profit Model 4h4219
November 2019 56
Idea - Strategic Business Model 4zm58
December 2019 45
Abcde Strategic Plan Model 2e1b2f
April 2022 0
Strategic Issues In Not For Profit Organizations 335qo
December 2019 30
November 2019 19

Strategic Business Model For Telecommunication 2f5g2r
November 2020 0More Documents from "Lavanya Winslet" 3n596v

Potential Appraisal.ppt 56t53
December 2019 76
Strategic Profit Model 4h4219
November 2019 56
Desing And Analysis Of Alloy Wheels By Using Ansys(3) (4) (4) (1) 1u5k1y
October 2021 0
Tsrtc Bus 5k486z
December 2019 108
Engage Server Installation Networking Guide V.4.1 Issue1 (1) 1v156z
December 2019 59